 |
|
Hearing
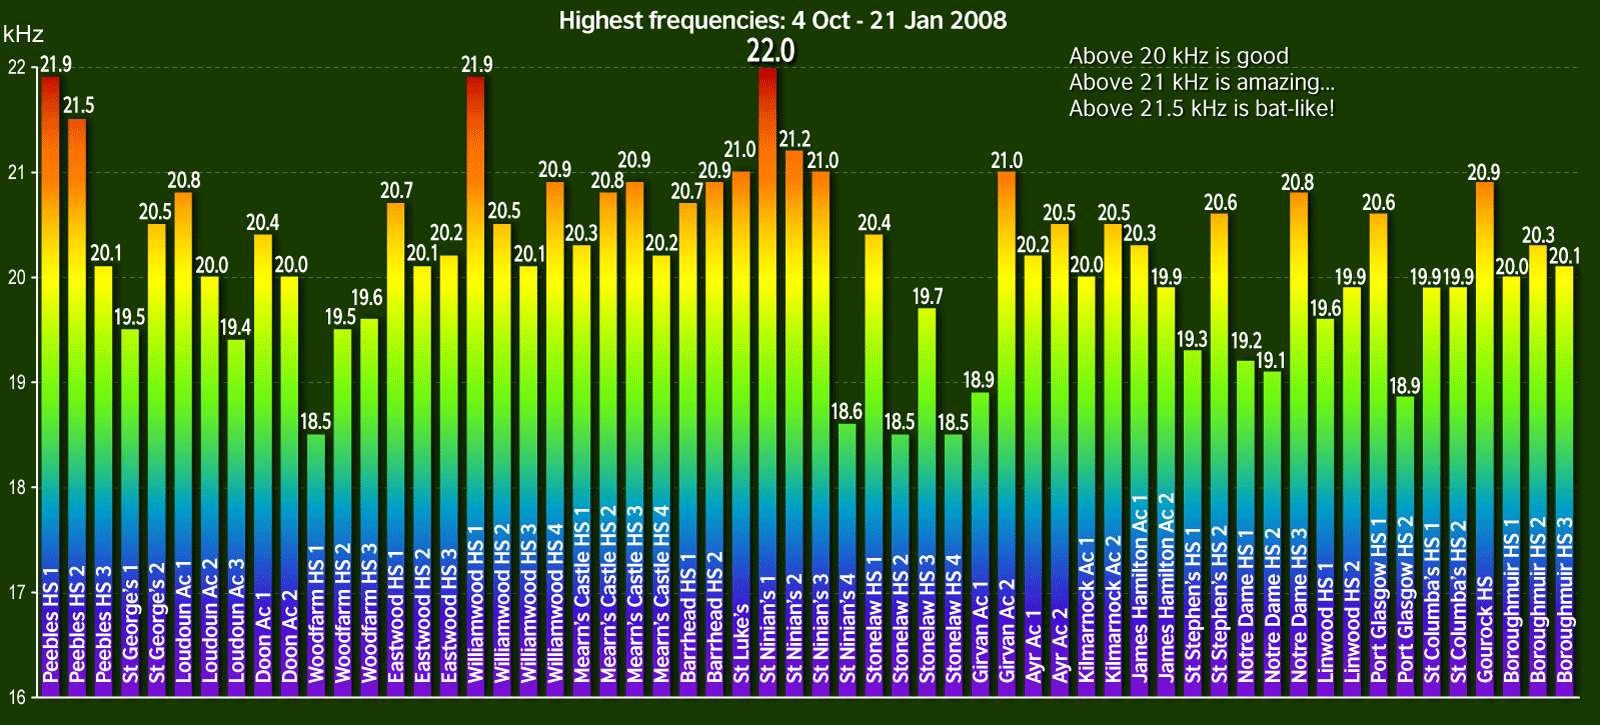
The sections below provide more information on some of the topics covered in the Senses show. Click on the links above to switch between this page (on hearing) and the page covering the vision demonstrations. Experiment #2: the highest frequency Using our signal generator, amplifier and speakers, we measured the highest frequency which could be heard by each session group. The normal range of human hearing extends to around 20-21 kHz; some of the results below were extraordinarily good! Some students at the first session at St. Ninian's High School were able to pick out a 22 kHz signal, which is bordering on the bat-like... The lower results should, of course, be considered in light of the fact that we have been carrying out our measurements in school halls, gyms and other large buildings, with all sorts of extraneous noises (including cars, tubas, and more exuberant pupils...) If you click on the small graph below, a window will open with a larger version. How did your school fair? Was your hearing up to it?
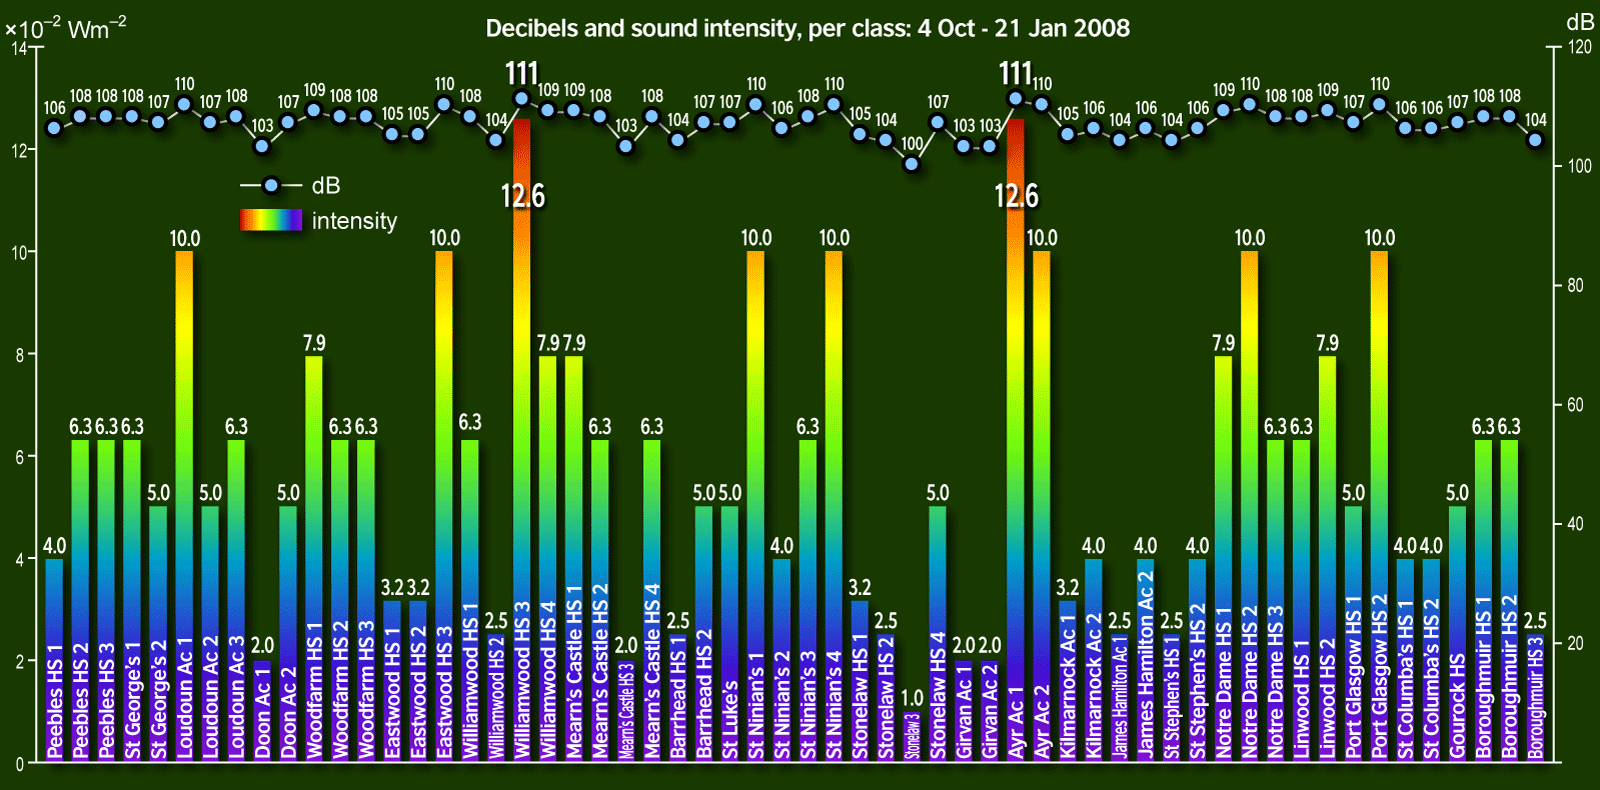
Experiment #3: the loudest class/pupil The images below (click for the larger versions) show the results of our sound level measurements, using the decibel meter. The upper line in each graph gives the result in decibels (see below for an explanation), and the bar graphs show the equivalent values in sound intensity. (Click here to find out how we can convert from decibel ratios to sound intensity.) The first graph gives the raw results for each class (and so doesn't take into account the size of each session group, which is dealt with next). As of 21 January 2008 the loudest group was a tie between the third session from Williamwood High School and the first from Ayr Academy, both rated at at 111 decibels (almost as loud as Concorde!!!!...) 1) decibels and intensity, per class
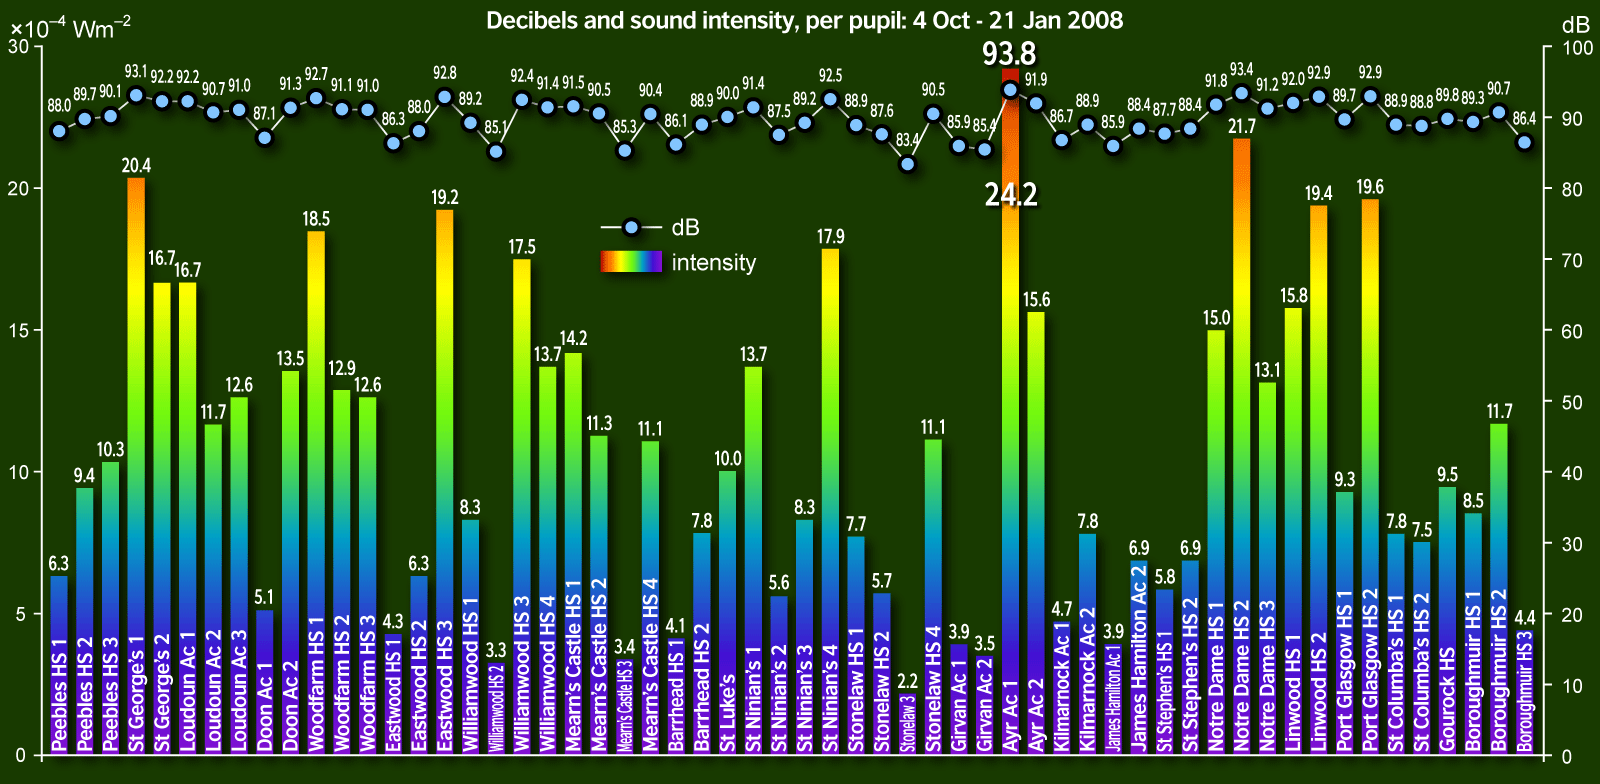
2) decibels and intensity, per pupil The following graph is more meaningful, in that it takes into account the number of pupils in each session, giving an average sound intensity per pupil, also converted back into decibels (as described at the bottom of this page). When we do that, we see that the morning session from Ayr Academy come out on top, at an average of 93.8 decibels per screaming S2: more than a road drill per pupil! (At the other end of the scale, the pupils of the third Stonelaw session were on average eleven times quieter... it must have been near the end of the day.)
Hearing Loss
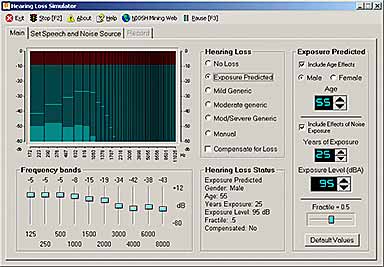
The program used in our show to simulate the damage caused over time by loud noise (and also simply due to old age) can be downloaded for educational use from the National Institute for Occupational Safety and Health (NIOSH) website. (See also the other links below.) You can record your own voice clips, and play them with a variety of hearing damage and age settings, along with background noise (as we do in the show). Particularly interesting is the effect of 95 dB noise on your ears: remarkable as it seems (and especially when you hear the 95 dB music clip in the show), this is the level of sound which is commonly reached using in-ear headphones, which focus the sound directly onto the eardrum. (We also tend to turn the volume up to compensate for the surrounding noise, which gets through the headphones.)
Sound clips The clips used in our demonstrations can be downloaded below. The small music clip used to illustrate the 95 dB sound was the introduction to "Today", from "Siamese Dream" by the Smashing Pumpkins.
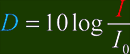
Appendix: decibels, sound intensity and "loudness" The intensity of sound is measured in power per unit area, and spans an enormous range: the loudest sound which is tolerable without causing pain to the ears is about one trillion (1,000,000,000,000) times more intense than the smallest sound which we can hear. This range is so huge that it makes more sense (for several reasons) to measure the intensity using a logarithmic scale, which is useful when you want to a) plot data over a vast range, like this, but b) most of the data occurs at fairly low values. The decibel measures a ratio of the intensity of a sound to I0, the lowest intensity of sound (the threshold of hearing) is I0, which is about 10-12 W / m2. (The highest intensity (which doesn't cause pain) is about 1 W / m2.) The equation for calculating decibels D from sound intensity I is:
There's more detail below on the equations we used (for those who are interested), but the main thing to realise about decibel readings is that small changes in decibels can represent large changes in intensity, as follows:
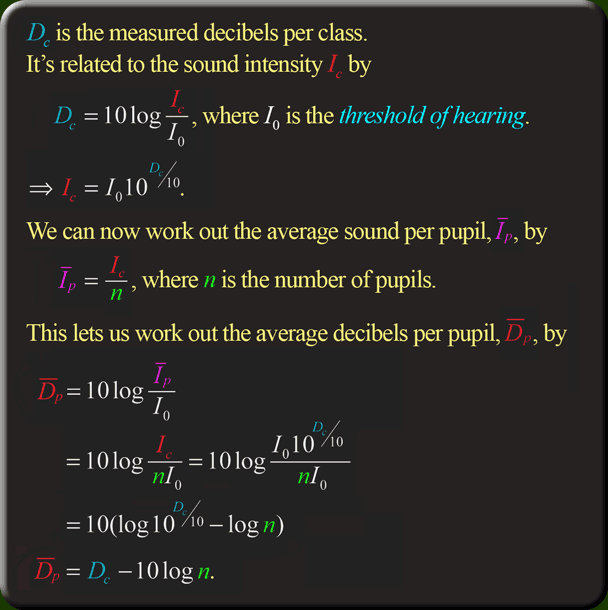
If one pupil emits 80 dB, two pupils will not emit 160 dB! You must ADD the intensities, and then convert back to decibels. So, for our graphs, we took the initial class reading for decibels, converted it to intensity, divided by the number of pupils to get an average intensity per pupil, then converted back to decibels to get an average decibel reading per student! Loudness As if it wasn't complicated enough, just because two sounds have a certain intensity (or decibel value), doesn't mean that you hear them as being equally loud. The human ear is highly frequency-dependent: it responds better to some frequencies than others. So, a noise of 60 dB at 1000 Hz will sound louder than a 60dB noise at 6000 Hz. (In fact, 1000 Hz is the frequency at which the ear responds best, which makes sense, since our auditory system has evolved in an environment in which sounds around that frequency tend to dominate!) There's another issue, too. The way in which our auditory system reacts to noise is actually logarithmic (which is another reason why decibels are a good way to represent sound). For example: two violins have twice the sound intensity as one violin on its own, but we don't hear them as being twice as loud. An old rule of thumb in orchestras was that you needed ten violins to sound twice as loud as one. (And a hundred violins to sound four times as loud.) This works well with the decibel scale, as you can see in the list above. Calculations If you're interested, the box below shows you how we get from the initial decibel measurement using the electronic detector, to the average sound intensity and decibels per pupil in each session... Click here to go back to the sound graphs...
|
|||||||||||||||||||||||||||||||||||||||